The Dutch hiring market, by occupation and region
91 open vacancies for every 100 unemployed people
The Netherlands, Q3 2026. 376,000 open vacancies and 415,000 unemployed people.
Open vacancies in the Netherlands
At the end of each quarter, all sectors.
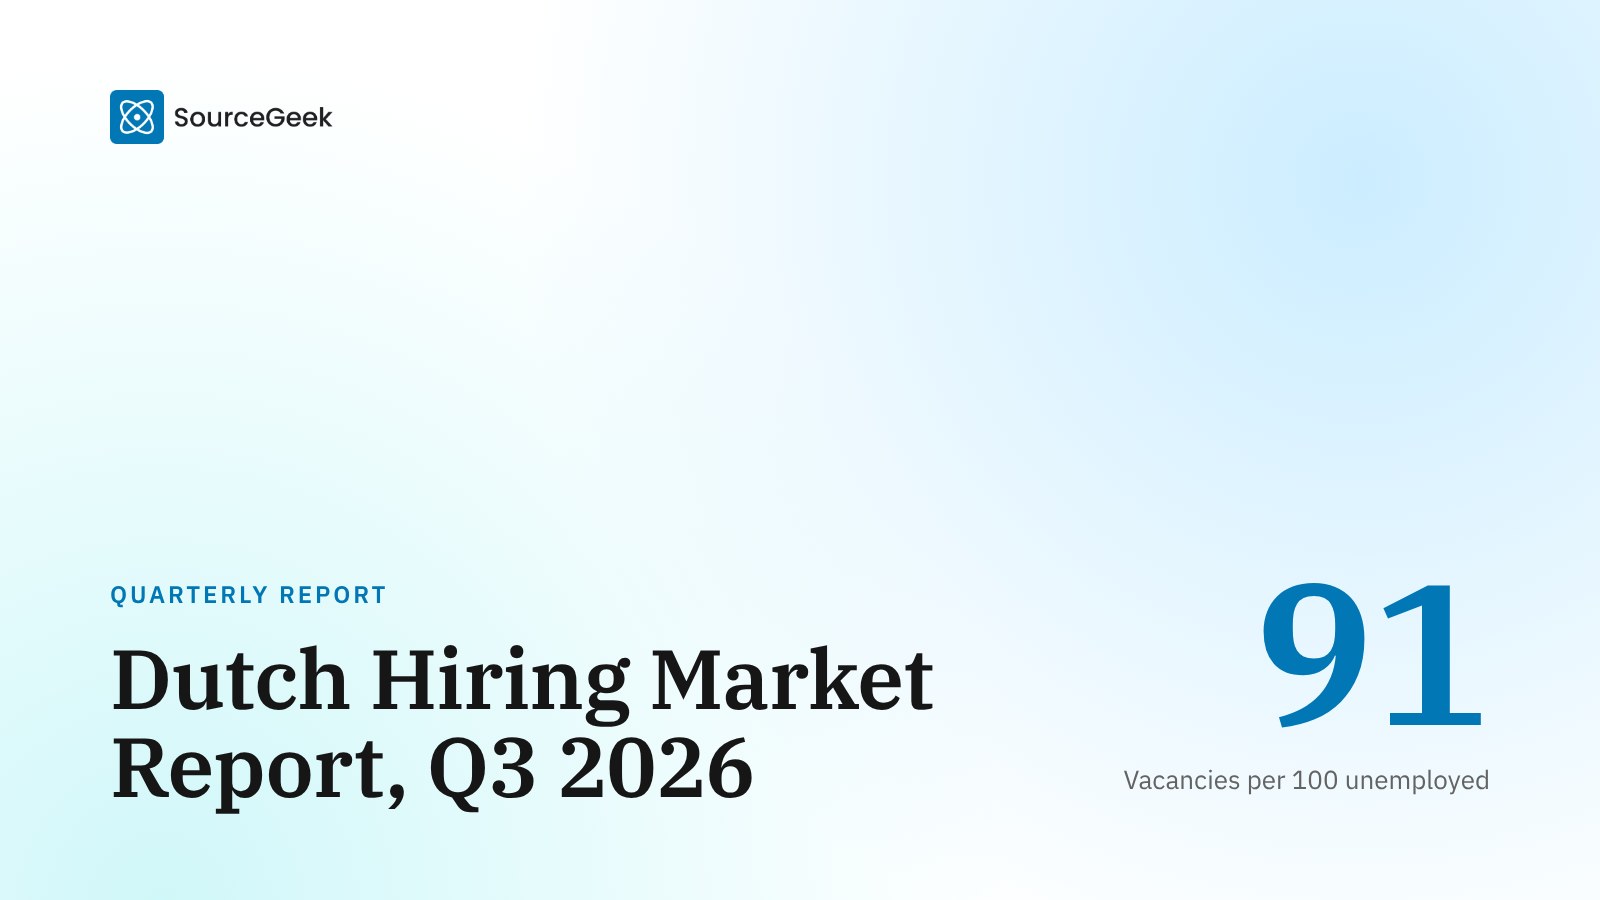
Quarterly report
Dutch Hiring Market Report, Q3 2026
The quarter's vacancies, tightness and wages by sector, province and occupation, with a free PDF.
Read the report
Pick an occupation
Each occupation has a page for the Netherlands and one per province and big city.
Education
Commercial
Business and administration
- AccountantsMedian €38.00 an hour
- Financial specialists and economistsMedian €37.40 an hour
- Business and management consultantsMedian €38.70 an hour
- Policy advisersMedian €41.20 an hour
- HR specialistsMedian €32.80 an hour
- BookkeepersMedian €28.60 an hour
- Office managers and executive assistantsMedian €27.90 an hour
- Administrative staffMedian €23.30 an hour
- Customer service staff and receptionistsMedian €22.00 an hour
- Finance administratorsMedian €25.80 an hour
- Work planners and logistics staffMedian €25.40 an hour
Management
Public administration, security and legal
Technical
- EngineersMedian €34.40 an hour
- Electrical engineersMedian €33.40 an hour
- Construction and engineering techniciansMedian €29.70 an hour
- Production supervisors in industry and constructionMedian €31.40 an hour
- CarpentersMedian €24.90 an hour
- Car mechanicsMedian €23.10 an hour
- Machine mechanicsMedian €25.70 an hour
- ElectriciansMedian €25.10 an hour
ICT
Healthcare and welfare
- DoctorsMedian €42.20 an hour
- Specialised nursesMedian €34.70 an hour
- PhysiotherapistsMedian €32.40 an hour
- Social workersMedian €31.00 an hour
- Psychologists and sociologistsMedian €38.00 an hour
- Nurses (vocational)Median €30.40 an hour
- Medical and dental assistantsMedian €25.50 an hour
- Group and residential support workersMedian €27.20 an hour
- Care workersMedian €25.50 an hour
Transport and logistics
How tight is each region?
| Region | Hiring | Vacancies per 100 unemployed | Unemployment |
|---|---|---|---|
| Overijssel | Much harder than average | 114 | 3.2% |
| Zeeland | Much harder than average | 111 | 3.3% |
| North Brabant | Much harder than average | 107 | 3.6% |
| Drenthe | Harder than average | 103 | 3.2% |
| Utrecht (province) | Harder than average | 101 | 4.2% |
| Limburg | About average | 95 | 3.7% |
| Gelderland | About average | 93 | 3.7% |
| Friesland | Easier than average | 85 | 3.6% |
| North Holland | Easier than average | 84 | 4.7% |
| South Holland | Easier than average | 79 | 4.5% |
| Groningen | Much easier than average | 72 | 4.6% |
| Flevoland | Much easier than average | 68 | 4.3% |
Sources and method
Figures from CBS (Statistics Netherlands) StatLine, published under CC BY 4.0, refreshed when CBS publishes:
- Werknemers; uurloon en beroep (86355NED), updated 30 October 2026
- Werkzame beroepsbevolking; beroep (86320NED), updated 30 October 2026
- Ontstane vacatures; beroepenindeling ROA-CBS 2014 (BRC 2014), SBI 2008 (85081NED), updated 30 June 2026
- Werkzame beroepsbevolking; beroep en regio's (indeling 2025) (86277NED), updated 13 February 2026
- Openstaande vacatures; SBI 2008, regio (83599NED), updated 30 October 2026
- Arbeidsdeelname; provincie (85268NED), updated 30 October 2026
The verdict compares the region's open vacancies per 100 unemployed people with the Dutch figure for the same quarter. CBS publishes vacancies per province, so a city uses its province. The estimate for a region spreads the national number of people in the occupation like the region's workforce in its occupation class. Figures CBS does not publish, because too few people were surveyed, are left out.
Occupation descriptions and skills from ESCO (European Skills, Competences, Qualifications and Occupations), v1.2.1, © European Union, reused under the Commission's reuse policy. An occupation group here covers several ESCO occupations, so each is shown with the one closest to it.
SourceGeek is not affiliated with CBS.